Conductive fillers in polymer powder, like copper spheres and flakes, affect Additive Manufacturing processes. Laser flash analysis enables the identification of process setting to print the best quality parts.
Image Credit: NETZSCH-Gerätebau GmbH
A previous article details the incentive to add conductive fillers to PA12 powders and produce complex components for thermal management with the Selective Laser Sintering (SLS) process.
The various steps of sample preparation are also outlined, which are vital for the quality of the results.
Researchers at the Institute of Polymer Technology (LKT) at the University of Erlangen-Nuremberg, prepared the samples as part of a study.[1]There they utilized various mixtures of copper spheres and flakes in different contents: 5 and 10 vol% copper spheres and 5 vol% copper flakes.
The energy density of 0.043 J/mm2 was held constant for all materials to identify any changes in the behavior of the process as a result of the fillers. An experimental build temperature of 167°C was determined for the PA12/Cu spheres powder.
For the PA12/Cu flakes mixture, it was necessary to increase the build temperature to 173°C. The assumption was that an increased thermal conductivity and lower specific heat capacity could be the cause. Therefore, the following analysis can be employed to thoroughly examine such effects.
At NETZSCH Analyzing & Testing, an LFA 467 Hyperflash® was used to evaluate the thermal diffusivity of the various mixtures of PA12 powder with copper particles in relation to the neat PA12 material.
A short light pulse heats the bottom surface of the sample, and, using an IR detector, the increase in temperature on the rear surface is measured as a function of time.
Once the sample temperature is stabilized, this is repeated for each temperature step, and the flash lamp is also fired numerous times over a period of minutes. The preparation of the samples is an extremely crucial factor which is detailed here.
Subsequent to loading the samples, the measurement is initiated under the conditions outlined in the following table:
Table 1. Measurement conditions. Source: NETZSCH-Gerätebau GmbH
| . | . |
|---|---|
| Sample holder | Z-direction: 12.7 mm square x- and y-direction: laminate sample holder 12.7 mm |
| Atmosphere | N2 |
| Gas flow | 100 ml/min |
| Temperature measuring points | 25, 40, 60, 80, 100, 120, 140, 160, 168, 180°C |
The NETZSCH Proteus® software automatically provides an appropriate model to the measured data to facilitate the calculation of the half-times, Figure 1.
Figure 1. Example of detector signal as a function of time at 25°C with the fitted curve (red) for the sample with 5 vol% Cu spheres. Image Credit: NETZSCH-Gerätebau GmbH
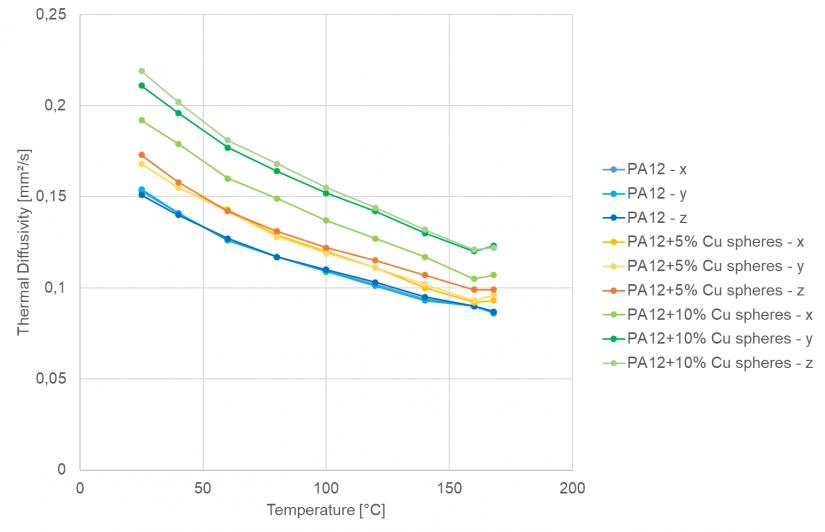
Figure 2 exhibits how the thermal diffusivity as a function of temperature and sample orientation for the neat PA12 is analyzed in contrast to the PA12/copper sphere mixtures.
Figure 2. Temperature dependence of thermal diffusivity in three measurement directions: Comparison of the neat PA 12 sample and the PA 12/Cu spheres mixture. Image Credit: NETZSCH-Gerätebau GmbH
As anticipated, the neat PA12 samples display no directionality, and the thermal diffusivity values are minimal. They display a general decrease with increasing temperature up to the melting temperature.
The samples with 5 vol% Cu spheres exhibit moderately increased values for the thermal diffusivity compared to the neat PA12, and the samples with 10 vol% Cu spheres display the greatest values of the three materials.
This is a result of the copper’s higher thermal diffusivity in contrast to the insulating matrix. For a majority of the samples, no directionality is noted due to the sphere’s isotropic properties.

Yet, the thermal diffusivity is marginally lower compared to the other two directions for the sample with 10 vol% Cu spheres in the thickness direction z. It is possible that this is due to the greater porosity of these samples, which was recorded by Lanzl et al.[1]
The LFA results signal a higher porosity between layers in the z-direction than a layer in the xy-plane.
Figure 3 shows observations of a different behavior with the copper flakes; here, a comparison of the thermal diffusivity measurements of all samples in the x-direction and of the flakes in all three directions was performed.
Figure 3. Temperature dependence of thermal diffusivity in three measurement directions: Comparison of the PA 12/Cu flakes and isotropic materials (blue – only x-direction). Image Credit: NETZSCH-Gerätebau GmbH
The flakes display much greater values for the thermal diffusivity in relation to the other mixtures with spheres and the neat PA12. A high degree of anisotropy was anticipated based on the 2D character of the filler.
The greatest thermal diffusivity is recorded in the y-direction followed by the x-direction. Through the thickness of a layer in the z-direction, the lowest values are achieved. This signals a higher preferential orientation in the xy-plane, which is potentially as a result of the powder application process.
Figure 4 displays a microscopy image of the cross-section of a single layer of the PA12/Cu flake mixture as recorded by Lanzl et al.[1]The image displays that the particles are in contact with each other, which means that the overall thermal resistance of the material (or, here, cross-section) should be reduced to a minimum.
Figure 4. Single layer of PA12 and 5 vol% copper flakes[1]. Image Credit: NETZSCH-Gerätebau GmbH
Most of the fillers are aligned horizontally, which relates to the xy-plane. However, it can be observed that some flakes are tilted at an angle, which, when compared to all other samples, results in higher thermal diffusivity in the z-direction.
Thermal diffusivity measurements offer considerable insights into both the orientation of the fillers and their proximity to one another without the necessity for additional optical imaging.
For further investigation or simulation, as well as the thermal diffusivity (a), thermal conductivity (l) is required. To calculate the thermal conductivity, the precise heat capacity (cp) and the density (r) are also needed:
λ(T)=a(T)∙cp(T)∙ρ(T)
Both the specific heat capacity and thermal diffusivity are determined as a function of temperature. The measurement and results of the cp–measurements are detailed here.
However, the density demands reusing the density at room temperature in addition to the thermal expansion coefficient for the temperature range evaluated:
ρ(T)=ρRT∙αv(T)
Employing the buoyancy-flotation method with water, the density at room temperature was assessed: using a Thermomechanical Analyzer (TMA), the thermal expansion coefficient (α) is measured, which will be explained in a later article.
The coefficient of expansion is direction-dependent and is calculated as follows:
αv = (αx + αy + αz)/3
Figure 6 exhibits how the resulting computed thermal conductivity values are plotted as a function of temperature for the various materials and mixtures.
Figure 5. Temperature dependence of the Thermal conductivity in three directions for neat PA 12 and PA12/Cu mixtures. Image Credit: NETZSCH-Gerätebau GmbH
The same trends as observed with the thermal diffusivity are seen:
However, the lower temperature dependence in addition to the moderate curvature at low temperatures is connected to the temperature dependence of the cp values.
For the application of such conductive fillers in thermal management, it is critical to modify the position of the 3D-printed parts to account for any anisotropy because of the coating process and filler geometry.
Concerning the process settings, specifically the build temperature, it was noted that it was necessary to process the mixture of the flakes at a build temperature of 173°C, which was 6°C more than the mixtures with spheres.
The higher thermal conductivity and the lower specific heat limit both lead to the reduced capability of heat storage in the compound and discharging of the heat, specifically in the xy-plane, where the highest conductivities with Cu flakes were acquired.
It is anticipated that the energy input from the laser is distributed more rapidly, resulting in a lower temperature. Thus, increasing the build temperature counteracts this effect. For a greater understanding of the influence of the various filler shapes on the energy input, Lanzl et al. examined the thickness of a single layer.
It was discovered that the layer thickness of the mixture with Cu flakes is considerably thinner. The researchers attributed this to the fact that the thermal conductivity in the xy-plane was greater than the thickness direction and to the increased diffuse reflection of the laser, which gives rise to lower energy input.
The supplementary analysis shows how critical it is to understand the changes in thermal diffusivity and conductivity for all the features of the SLS process while also knowing the most appropriate process settings.
This information has been sourced, reviewed and adapted from materials provided by NETZSCH-Gerätebau GmbH.
For more information on this source, please visit NETZSCH-Gerätebau GmbH.